


World vector map
Apache ECharts is an open source Javascript visualization
library with very extensive customization options and powerful
rendering engine. The library provides more than 20 chart
types available out of the box, along with a dozen components,
and each of them can be arbitrarily combined to use. And
progressive rendering and stream loading make it possible to
render 10 million data in realtime. This example shows a
simple geo chart type rendered in SVG.
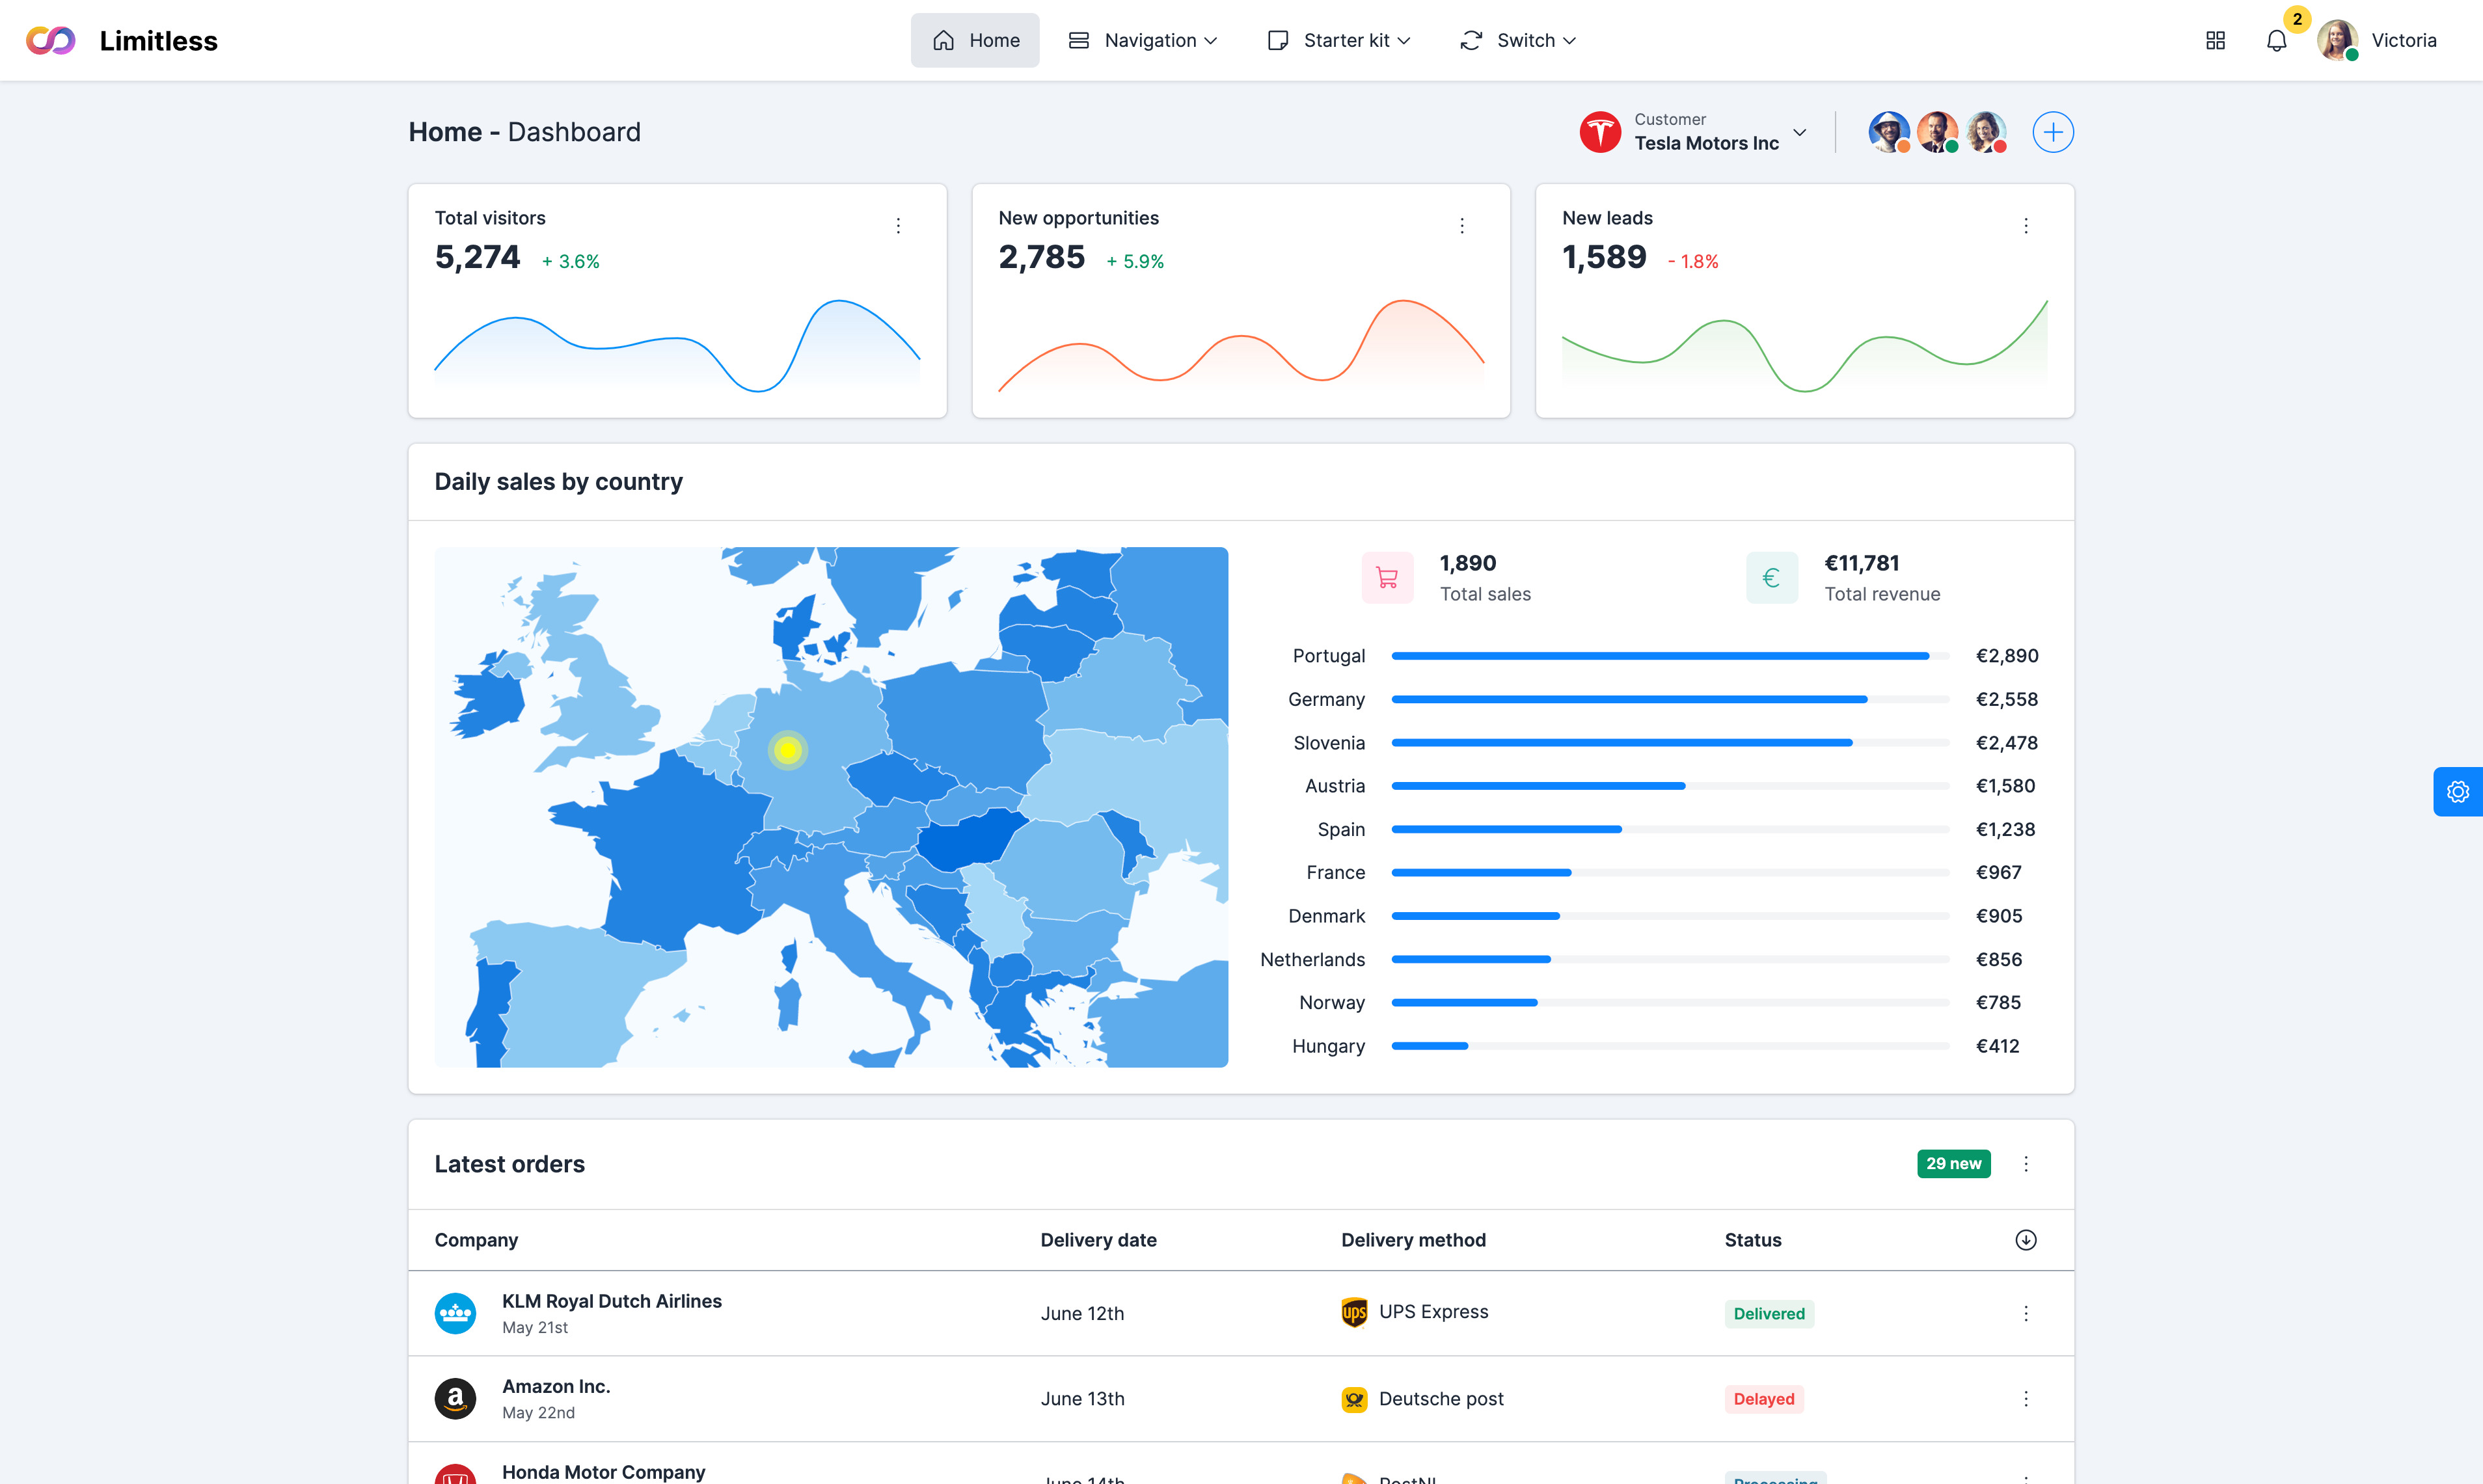
Combination with chart
ECharts engine allows you to combine multiple chart types with
shared or multiple data sets. This example demonstrates a
combination of world map and
scatter chart. The demo data used in this example
represents population by country. Countries and bubbles are
both interactive: hover on bubbles to see the tooltip with
details, hover on country to see the country name. This
behaviour can be easily configured.
Viewport
In this example, world map is zoomed in to a certain
viewport (Europe) that is specified in
center configuration option in longitude and
latitude by default.
Effect scatter
ECharts maps support effectScatter series
type, which adds the scatter (bubble) graph with ripple
animation. The special animation effect can visually
highlight some data.
Enable scale
Use roam: 'scale' option to enable map
zooming on scroll. You can also use
scaleLimit option to set minimum and maximum
scaling, where the default value is '1'.
Enable move
If you set roam option to
'move', map becomes draggable, but not
scalable. Zoom level and aspect ratio of the map are fixed
in this case.
Enable scale and move
If you set roam option to true,
map becomes draggable and scalable. All options from both
scale and move examples also
work in this setup.
Initial zoom level
You can control the initial zoom rate of current viewport
with zoom option. The default value is
1, in this example it's set to
6 to scale down Europe map.