


Simple line chart
Example of simple line chart based on Google
visualization library. A line chart or line graph is a type of
chart which displays information as a series of data points
called 'markers' connected by straight line segments. Line
Charts show how a particular data changes at equal intervals
of time. A line chart is rendered within the browser using
SVG or VML. Displays tips when
hovering over points.
Simple area chart
Example of area chart. An area chart or area
graph displays graphically quantitive data. It is based on the
line chart. The area between axis and line are commonly
emphasized with colors, textures and hatchings. Commonly one
compares with an area chart two or more quantities. An area
chart that is rendered within the browser using
SVG or VML. Displays tips when
hovering over points.
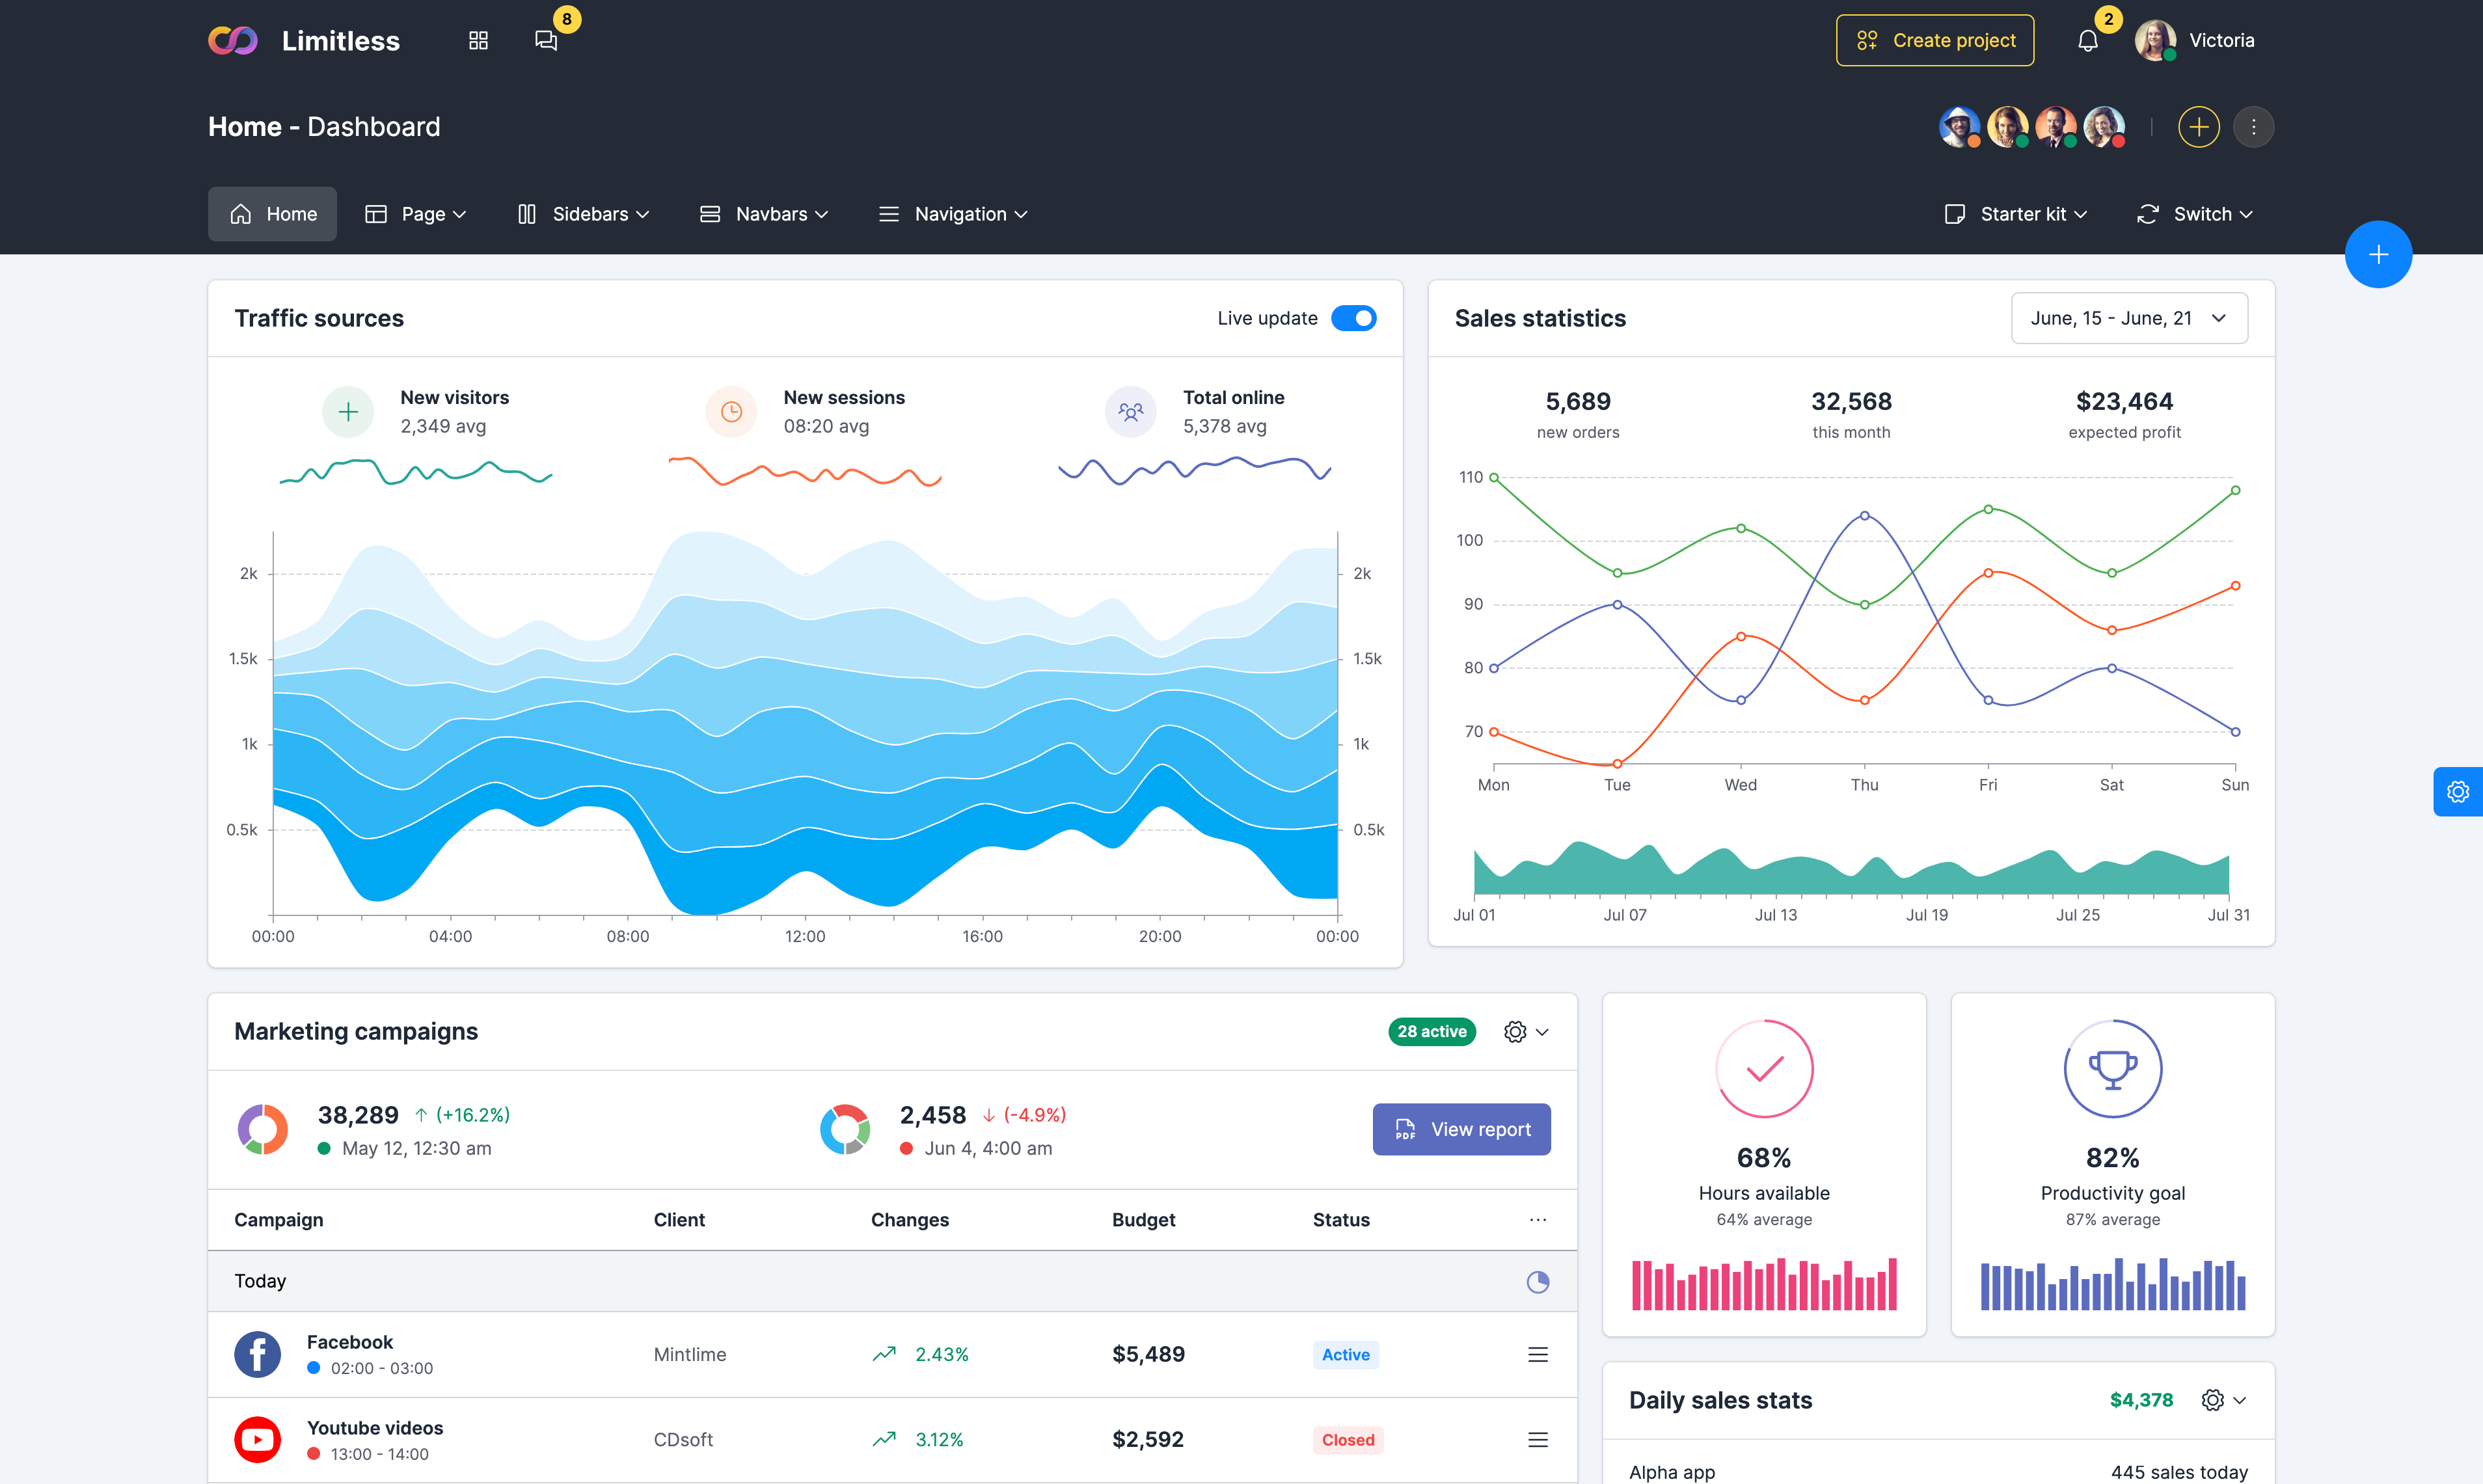
Stacked area chart
Example of stacked area chart. By default, the
area chart draws the series on top of one another. You can
stack them atop one another instead, so that the data values
at each x-value are summed. The order of the legend entries in
stacked chart is different - it is reversed, placing series 0
at the bottom, to better correspond with the stacking of the
series elements, making the legend correspond to the data.
Line intervals
Example of line intervals in charts. Intervals
around a series might be used to portray confidence intervals,
minimum and maximum values around a value, percentile
sampling, or anything else that requires a varying margin
around a series. Line intervals are sometimes used to show the
raw data from which a trendline was extracted. To draw a
trendline on a chart, use the trendlines option and specify
which data series to use.
Area intervals
Example of area intervalsin charts. An area
interval renders interval data as a set of nested shaded
areas. Nesting of pairs of columns is similar to that of box
intervals, except that an even number of columns is required.
This is accomplished by setting style to 'area'.
There are six styles of interval: line,
bar, box, stick,
point, and area. For even greater
customization, intervals styles can be combined inside one
chart.
Stepped area chart
Example of stepped area chart. A stepped area
chart is rendered within the browser using SVG or
VML. Displays tips when hovering over steps. The
Step Line chart type is similar to the Line chart type, but it
does not use the shortest distance to connect two data points.
Instead, this chart type uses vertical and horizontal lines to
connect the data points in a series forming a step-like
progression.